Published study · Catchment risk
Mapping where flood risk persists in the Mpanga catchment
Flood extent grows as events become rarer and more severe, but the places carrying the greatest risk remain concentrated. This study combines hydrological modelling with social and environmental vulnerability to show where action matters most.
Read the published paper ↗- Modelled extent
- 120.5—348.4 km²
- Return periods
- 5—100 years
- High or very high risk, 100-year scenario
- 21.2%
- Model performance
- 0.83 / 0.71 NSE
Where does a flood become a risk to people and places?
A hazard map shows where water may spread. It does not, by itself, show where that water will cause the greatest harm. In the Mpanga River catchment in western Uganda, the study therefore examines flood hazard alongside population, land use, terrain, and proximity to the river.
Building one picture from several kinds of evidence
The Rainfall–Runoff–Inundation model was used to simulate flooding for 5-, 10-, 25-, 50-, and 100-year return periods. An Analytical Hierarchy Process combined nine vulnerability indicators, and GIS overlays brought hazard and vulnerability together as spatial risk. The model achieved Nash–Sutcliffe efficiency values of 0.83 in calibration and 0.71 in validation.
- RRI
- Gumbel frequency analysis
- AHP · 9 indicators
- GIS risk overlay
03 / Findings
From flood extent to priorities for action
Flood extent expands sharply
Modelled inundation increases from 120.5 km² in the 5-year scenario to about 348.4 km² in the 100-year scenario. The change in magnitude is substantial, even though the central flood corridors remain geographically persistent.
Risk concentrates along identifiable corridors
The most exposed areas align with the Mpanga River’s middle reaches and with parts of Kamwenge and Kitagwenda, where flood hazard intersects with settlement, land use, and other dimensions of vulnerability.
More than one fifth reaches the two highest classes
In the 100-year scenario, 20.7% of the catchment is classified as high risk and 0.5% as very high risk. These classes are model outputs intended to guide prioritisation, rather than property-level predictions.
Mitigation choices produce different modelled effects
The study tests channel improvement, enhanced infiltration, and dam construction scenarios. Their estimated reductions are useful for comparing strategies inside the model, but engineering feasibility, environmental effects, cost, and local priorities still require separate assessment.
Read the maps
Risk changes with the return period
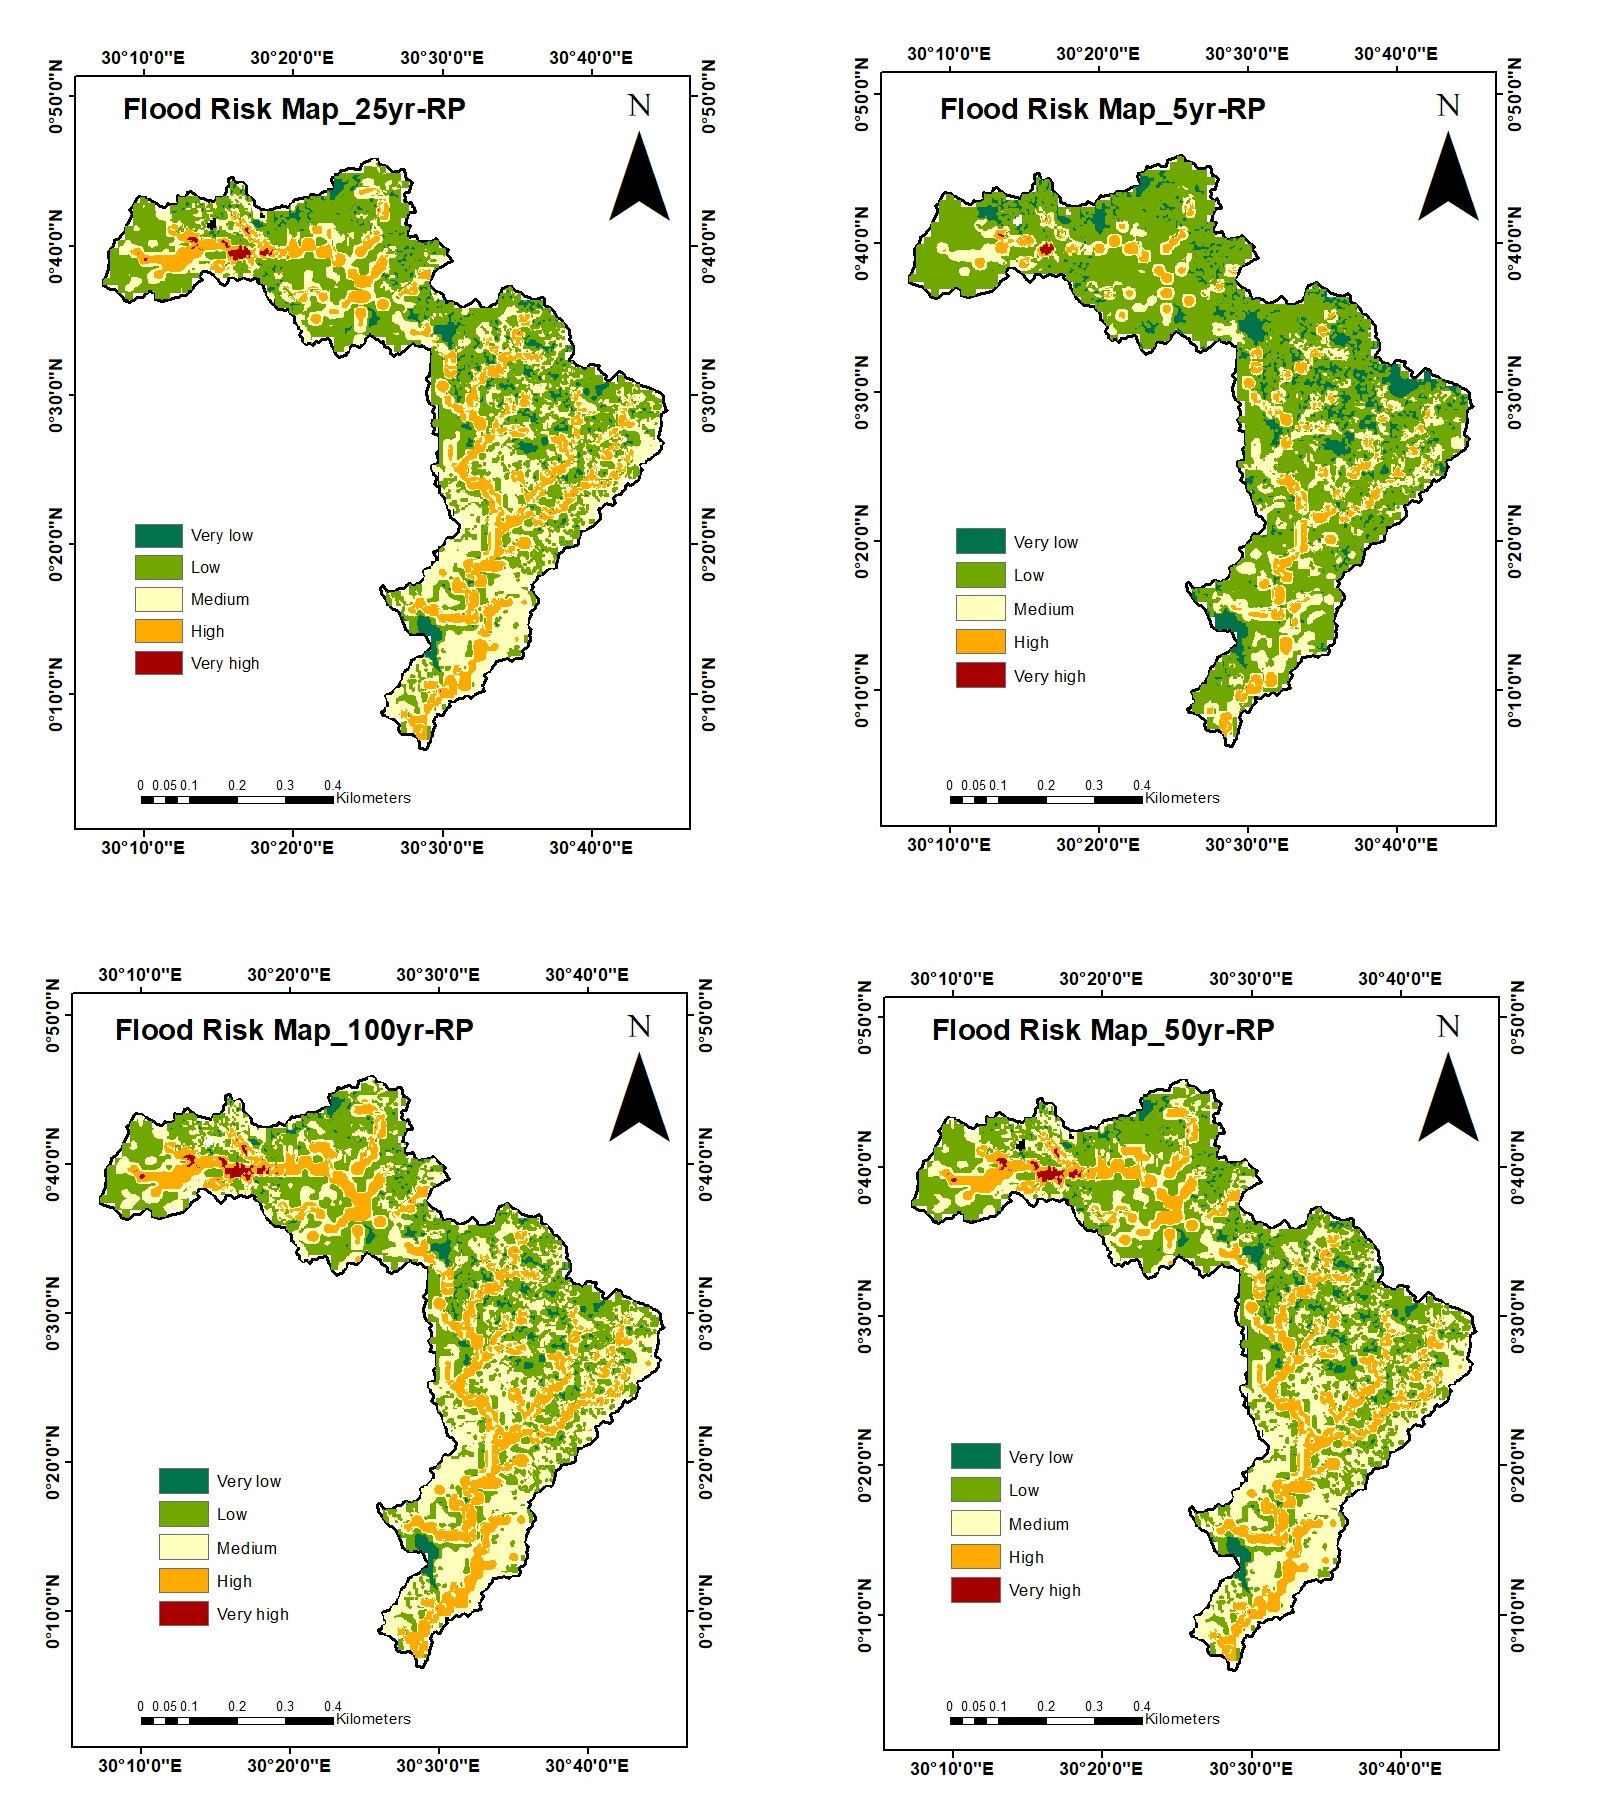
The four panels classify flood risk from very low to very high for 5-, 25-, 50-, and 100-year return periods. Reading them together shows both the expansion of risk and the persistence of particular corridors.
Figure 6, Namugenyi et al. (2026). Four original panels combined; panels unchanged and display size adjusted. CC BY 4.0 · Source paper
04 / Contribution
How this study fits my work
As a co-author, this study forms part of my wider work on hydrological risk in data-limited regions. It connects catchment modelling with a practical decision question: how can limited attention and investment be directed toward the places where hazard and vulnerability overlap?
05 / Interpretation
How to read these maps responsibly
The assessment is catchment-scale and depends on the resolution and quality of available hydrological, population, and land-use data. AHP weights formalise expert and literature-based judgements, while return periods express probability rather than a timetable. The mitigation scenarios are comparative model experiments, not final engineering designs or guarantees of avoided damage.
Publication
GeoHazards · 2026
Namugenyi, B., Abdelmoneim, H., Abdelbaki, C., Kantoush, S. A., Kumar, N., Ahana, B. S. & Saber, M. (2026). Flood Hazard and Risk Assessment in the Mpanga River Catchment Using Integrated Hydrological Modeling and Decision Support Tools. GeoHazards, 7(2), 54.