Published study · First author · Rainfall change
Less rain, fewer wet days: four decades around Lake Kivu
In northeastern South Kivu, rainfall has fallen steadily since the wet 1980s. A study of 43 years of satellite and gauge rainfall estimates shows the decline in every territory, and a dry season that has become the least predictable part of the year.
Read the published paper ↗- Rainfall record
- 43 years
- Annual rainfall trend
- −3.5 to −5.7 mm / year
- Study area
- 10,262 km²
- Analysis points
- 22
How to read these numbers: the trend range covers the four territories, from −3.53 mm per year in Idjwi to −5.72 mm per year in Kalehe. All four declines are statistically significant.
Why look closely at rainfall here?
Northeastern South Kivu covers the territories of Kabare, Bukavu, Kalehe and the island of Idjwi in Lake Kivu, at elevations from 799 to 3,448 m. Smallholder farming depends on two rainy seasons, yet the region has few long-running weather stations. Without fine-scale records, it is difficult to plan crops, water supply or adaptation.
Filling a data gap with satellite rainfall
We used daily CHIRPS rainfall estimates, which blend satellite observations with station data at 0.05° resolution, for 22 points across the four territories from 1981 to 2023. After checking consistency and serial correlation, we measured variability, standardised rainfall anomalies, and trends with the Mann-Kendall test, Sen’s slope and Innovative Trend Analysis. Climate indices described how often it rains and how intensely.
- CHIRPS · 0.05°
- Mann-Kendall · Sen’s slope
- Innovative Trend Analysis
- Climpact rainfall indices
03 / Findings
From a wet decade to a drier climate
The 1980s were the wet exception
In 1981–1990, 70% of the years had above-average rainfall, and 1987 and 1988 were extremely wet in Bukavu, Kabare and Idjwi. In 2001–2010 about half the years fell below the long-term average, and in 2011–2023 most did.
Annual rainfall is declining everywhere
Mann-Kendall and Sen’s slope show significant declines of −5.72 mm per year in Kalehe, −4.39 in Kabare, −3.88 in Bukavu and −3.53 in Idjwi. Innovative Trend Analysis confirms the downward trend in all four.
Fewer rainy days
Total wet-day rainfall declined significantly in all four territories, and days with at least 10 mm of rain became significantly fewer everywhere except Bukavu, where the decline was marginal. The trends in the most extreme single-day rainfall were not significant.
The dry season is the least predictable
Year-to-year variation is small for annual totals, with a coefficient of variation of 8.2–8.5%. In the June–August dry season it exceeds 30% in Kabare and Bukavu, which makes dry-season water supply the most uncertain.
Read the anomalies
Four decades of wetter and drier years
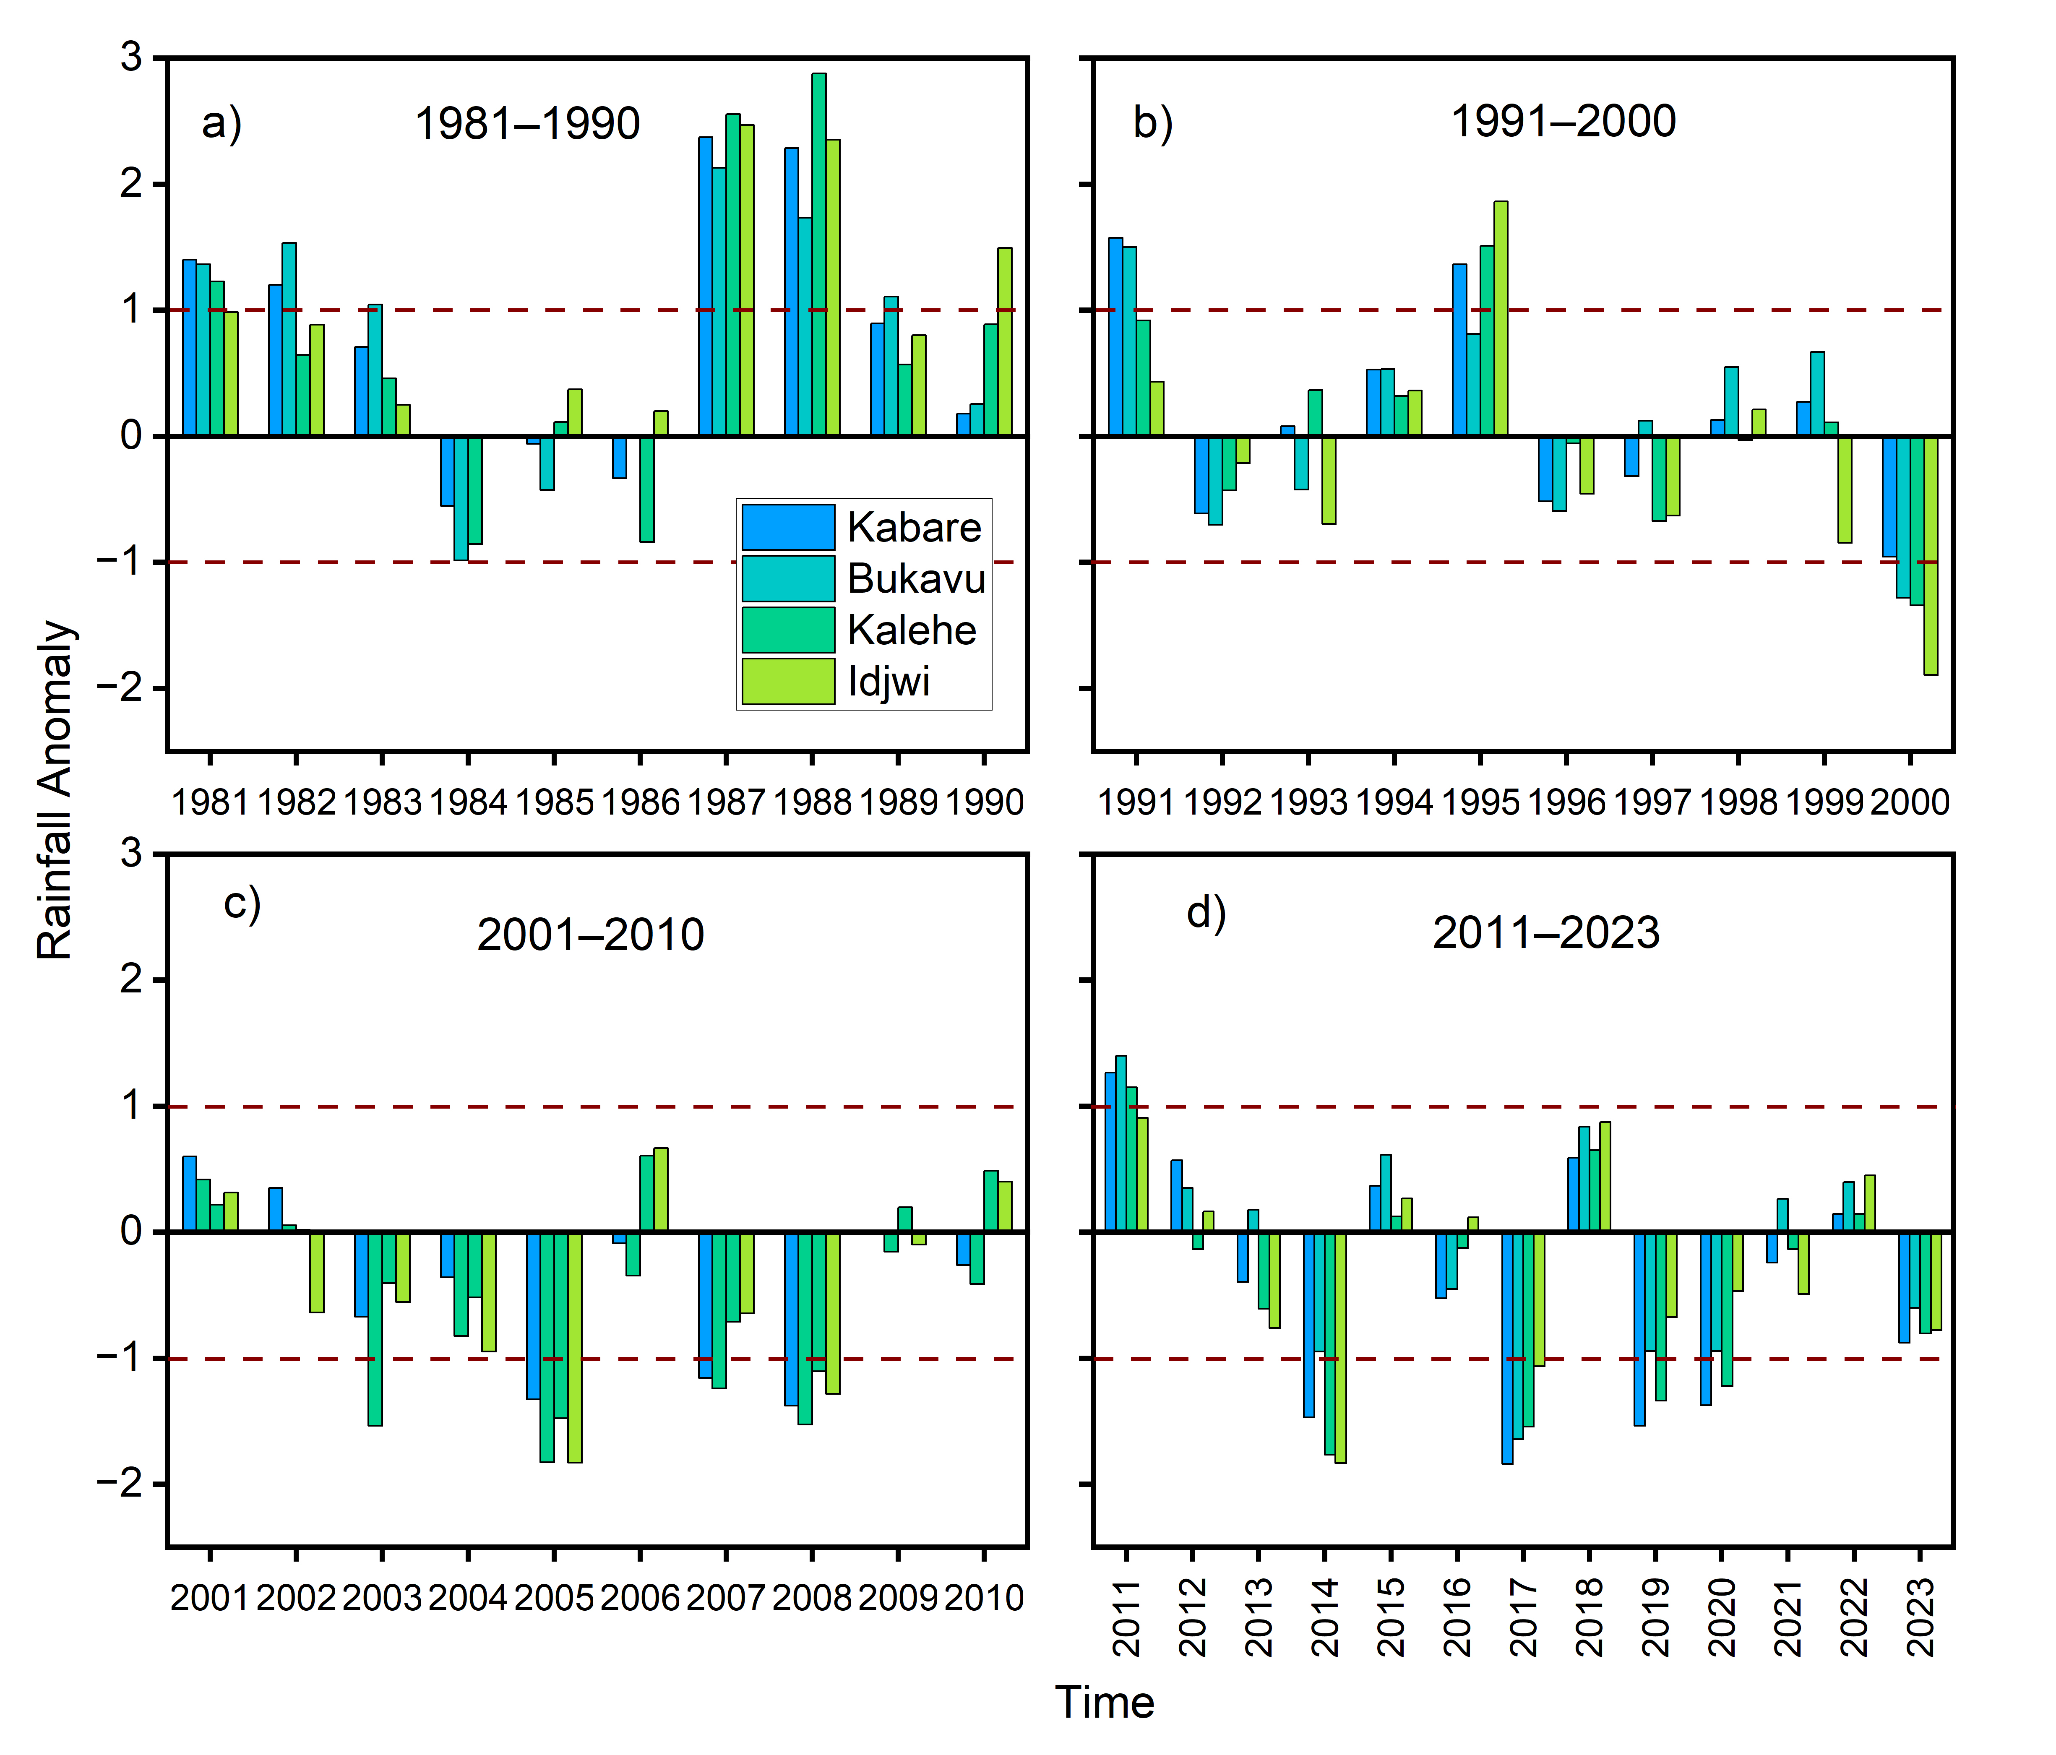
Each bar shows how far one year’s rainfall departed from the 1981–2023 average, in standard deviations, for the four territories. Bars above zero are wetter years and bars below zero drier ones; the dashed lines mark one standard deviation. Positive bars dominate the 1980s; negative bars become more common after 2000.
Figure 8, Ahana et al. (2024). © The authors. Reproduced unchanged; display size adjusted. CC BY 4.0 · Source paper
04 / Contribution
My contribution
I led this study as first author. With Vithundwa Richard Posite and Djessy Karl Maouly, I prepared the material, collected the data and carried out the analysis, and I wrote the initial draft with Vithundwa Richard Posite. The co-authors reviewed and improved later revisions, as recorded in the paper’s author-contribution statement.
05 / Interpretation
What these trends can and cannot tell us
CHIRPS is a blended satellite product, and the scarcity of ground stations in the region meant it could not be cross-checked locally; the study relies on validations of CHIRPS elsewhere in tropical Africa. The analysis describes observed change from 1981 to 2023. It does not project future rainfall or measure how much climate change, deforestation or land use each contribute.
Publication
Earth Systems and Environment · 2024
Ahana, B. S., Posite, V. R., Maouly, D. K., Abdelbaki, C., Kantoush, S. A., Nguyen, B. Q. & Kumar, N. (2024). Changing Rainfall Patterns in the Northeastern South Kivu Region, Democratic Republic of the Congo: A Detailed Analysis Using CHIRPS Rainfall Data (1981–2023). Earth Systems and Environment, 8(4), 1733–1750.