Published study · Mountain ecosystems
Watching the Rwenzori’s vegetation from space
Twenty-three years of satellite observations show where the vegetation of the Rwenzori Mountains remains healthy, where it is under stress, and how its greenness has declined since 2002.
Read the published paper ↗- Satellite record
- 23 years
- Processed images
- 3,586
- Mean NDVI, 2002 → 2024
- 0.56 → 0.31
- Mean leaf area index, 2002 → 2024
- 2.20 → 0.92
How to read these numbers: the 2002 and 2024 values are mean annual maps averaged over the whole range. Among the annual trends, only the decline in NDVI is statistically significant.
A biodiversity hotspot under pressure
The Rwenzori Mountains run about 110 km along the border of DR Congo and Uganda and rise to 5,109 m. Their montane forests and afro-alpine vegetation hold endemic species and feed the rivers of the surrounding region. Glacier retreat here is well documented, but long-term change in the vegetation of the higher slopes has received much less attention.
Four satellite lenses on one mountain range
The study used MODIS Aqua observations from 2002 to 2024, chosen for afternoon overpasses that are less affected by morning cloud and fog. Two vegetation indices, NDVI and EVI, measured greenness at 250 m; two biophysical parameters, leaf area index (LAI) and the fraction of absorbed photosynthetically active radiation (FPAR), measured canopy structure and function at 500 m. After quality filtering, Mann-Kendall tests, change-point analysis and hotspot statistics traced change in time and space.
- MODIS Aqua
- NDVI · EVI · LAI · FPAR
- Mann-Kendall · change points
- Getis-Ord Gi* hotspots
03 / Findings
A slow decline with clear patterns
Greenness has fallen since 2002
Mean NDVI fell from 0.564 in 2002 to 0.308 in 2024, and mean EVI from 0.367 to 0.213. The annual decline in NDVI is statistically significant, which points to long-term vegetation degradation.
The dry season shows the stress
The significant trends are negative and concentrated in the December–February dry season: FPAR in December, and both FPAR and LAI across the season. Positive trends in June and September were not significant.
The healthiest vegetation sits mid-slope
Hotspots of dense vegetation lie mainly between 1,400 and 2,800 m on the northeastern, eastern and southern slopes. Coldspots occur above 3,000 m around the glaciated peaks and below 1,400 m on the western Congolese slopes, where human pressure fragments the cover.
A shift in 2023, without a known cause
Change-point analysis found a break in 2023 in all four products. The authors could not link it to a documented event, so its drivers remain uncertain.
Read the maps
Where vegetation clusters as healthy or stressed
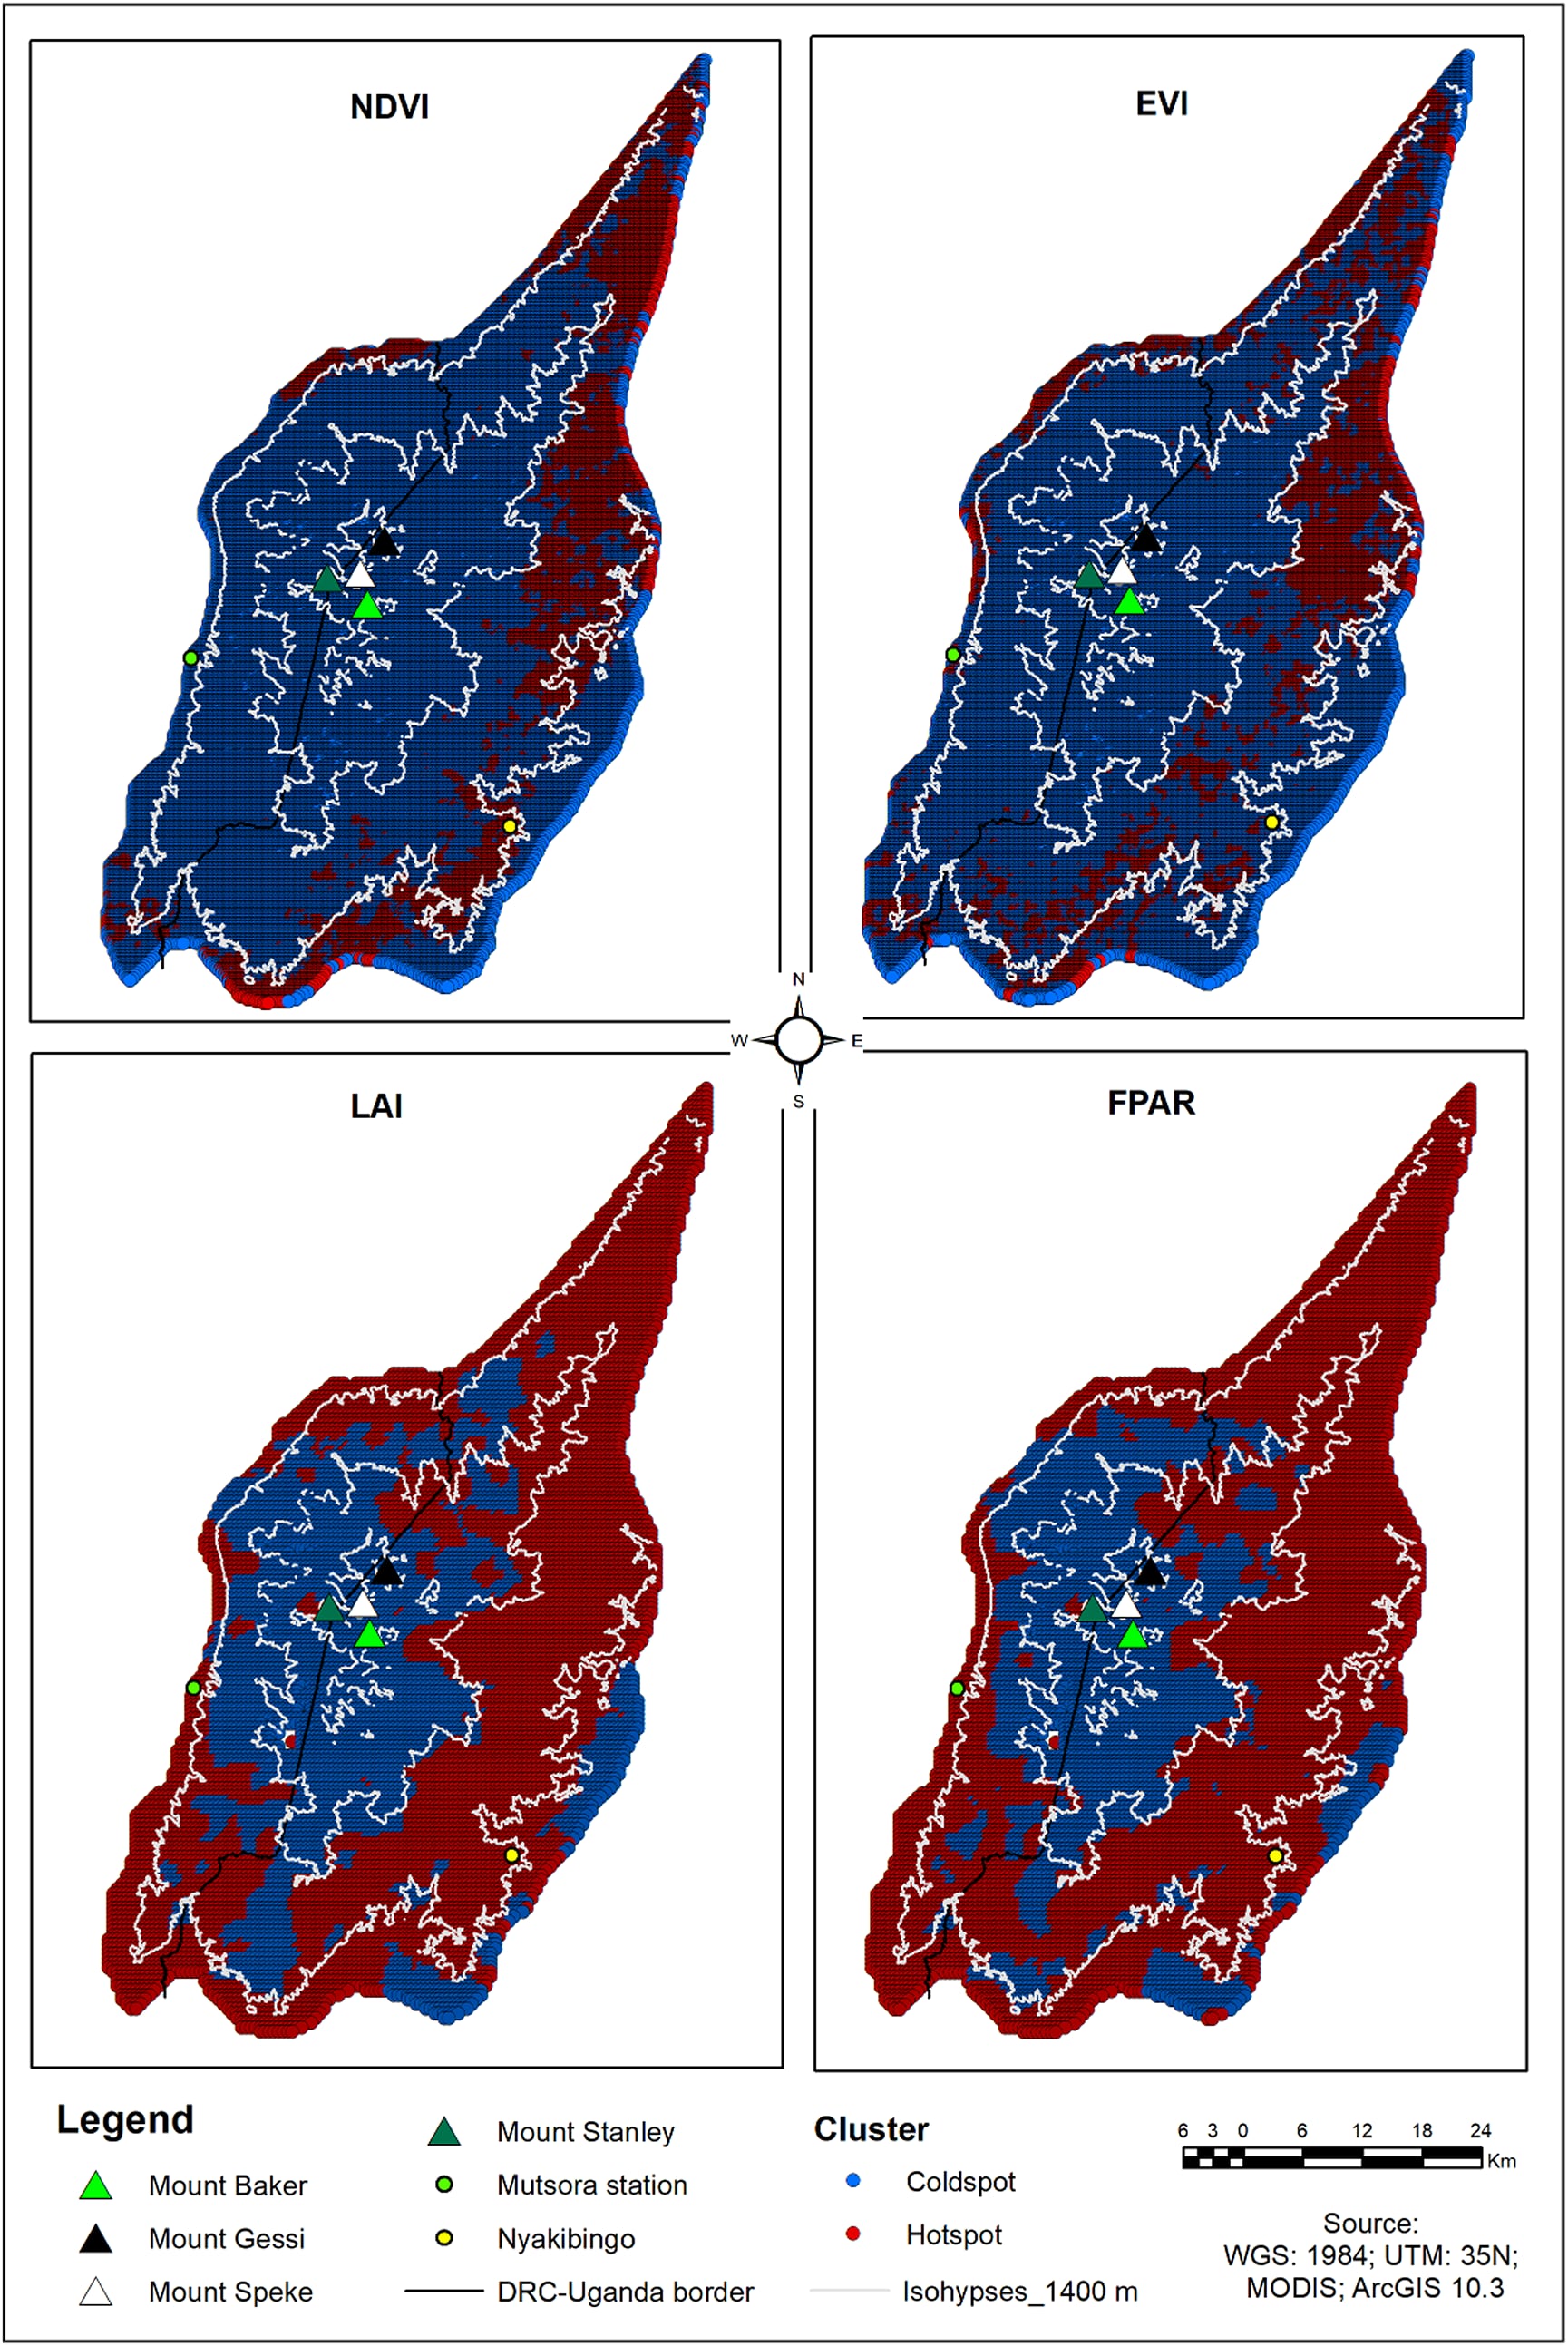
Hotspot analysis of four satellite products across the Rwenzori Mountains. Red marks statistically significant clusters of high values, blue clusters of low values. Coldspots gather above 3,000 m around the glaciated peaks and on the lower western slopes; hotspots lie mostly at mid-elevations on the northeastern, eastern and southern sides.
Figure 10, Posite et al. (2025). © The authors. Reproduced unchanged; display size adjusted. CC BY 4.0 · Source paper
04 / Interpretation
What the satellites can and cannot see
At 250–500 m, MODIS pixels mix different land covers, and NDVI saturates over dense forest; EVI, LAI and FPAR were added to offset this. Persistent cloud, especially from August to November, still leaves gaps. The study identifies where and when vegetation changed; it infers rather than measures the roles of climate and land use, and recommends radar and lidar data to strengthen future monitoring.
Publication
Earth Systems and Environment · 2025
Posite, V. R., Ahana, B. S., Abdelbaki, C., Saber, M., Kantoush, S., Khaldoon, M., Guadie, A. & Kumar, N. (2025). Decoding Vegetation Dynamics in High-Altitude Tropical Ecosystems: A Spatio-Temporal Assessment Using Multi-Index and Biophysical Remote Sensing Products (2002–2024). Earth Systems and Environment, 10(3), 2403–2423.