Published study · First author · Hydrological extremes
When reservoirs change the timing of climate extremes
A rainfall deficit does not become a river-flow deficit immediately. Lake Kivu and the reservoirs along the Ruzizi can delay and moderate that transition—but the study finds that this buffering relationship may become faster and less stable under future climate conditions.
Read the published paper ↗- Historical lag
- ≈3 months
- Projected SSP5-8.5 lag
- 0.19 months
- Historical SPI12–SSI3 correlation
- 0.62
- Peak mid-century correlation
- 0.74
Interpretation: a shorter lag means streamflow responds more quickly to the meteorological anomaly in the simulation. It does not predict the exact timing of every event.
How much warning time exists between a climate anomaly and its river response?
Meteorological extremes begin with unusually dry or wet conditions. Hydrological extremes appear later as low flows or floods. Reservoirs can store, release, and redistribute water between those two stages. In a transboundary basin, understanding that delay is essential for hydropower operation, drought preparation, flood management, and coordination between countries.
Following extremes across time scales
The study uses SWAT simulations driven by bias-corrected outputs from three CMIP6 climate models under SSP2-4.5 and SSP5-8.5. The Standardized Precipitation Index describes meteorological conditions and the Standardized Streamflow Index describes hydrological conditions. Correlation, lag, and non-linear response analyses compare historical behaviour with mid- and late-century futures.
- SWAT
- CMIP6 · 3 models
- SPI · SSI
- Correlation and lag
03 / Findings
A buffering relationship that changes with climate
Reservoirs create a historical buffer
Historically, SPI12 and SSI3 show a moderate correlation of 0.62 and a lag of about three months. Lake Kivu and downstream infrastructure help absorb short-term rainfall fluctuations and regulate their expression in river flow.
The projected response becomes much faster
Under SSP5-8.5, the reported lag contracts to 0.19 months. This suggests a much narrower interval between a meteorological anomaly and the corresponding hydrological response in the modelled future.
A stronger mid-century link does not persist
The SPI12–SSI3 correlation reaches 0.74 in the mid-century analysis, but falls to a range of 0.19–0.44 toward the end of the century. A weaker relationship makes rainfall alone a less reliable guide to future streamflow extremes.
Buffering capacity is not fixed
Reservoirs moderate floods and sustain dry-season flows, but their effect depends on climate, storage, and operation. Cooperative rules and seasonal forecasting therefore become part of climate adaptation rather than background infrastructure management.
Read the projections
The climate signal behind the changing reservoir response
The seasonal patterns place the lag results in context. The circles group years with similar seasonal conditions; each ring compares the four rainfall or temperature seasons, and the branches show how closely years cluster together.
Figure 11 · Rainfall
Seasonal rainfall becomes more variable across future pathways
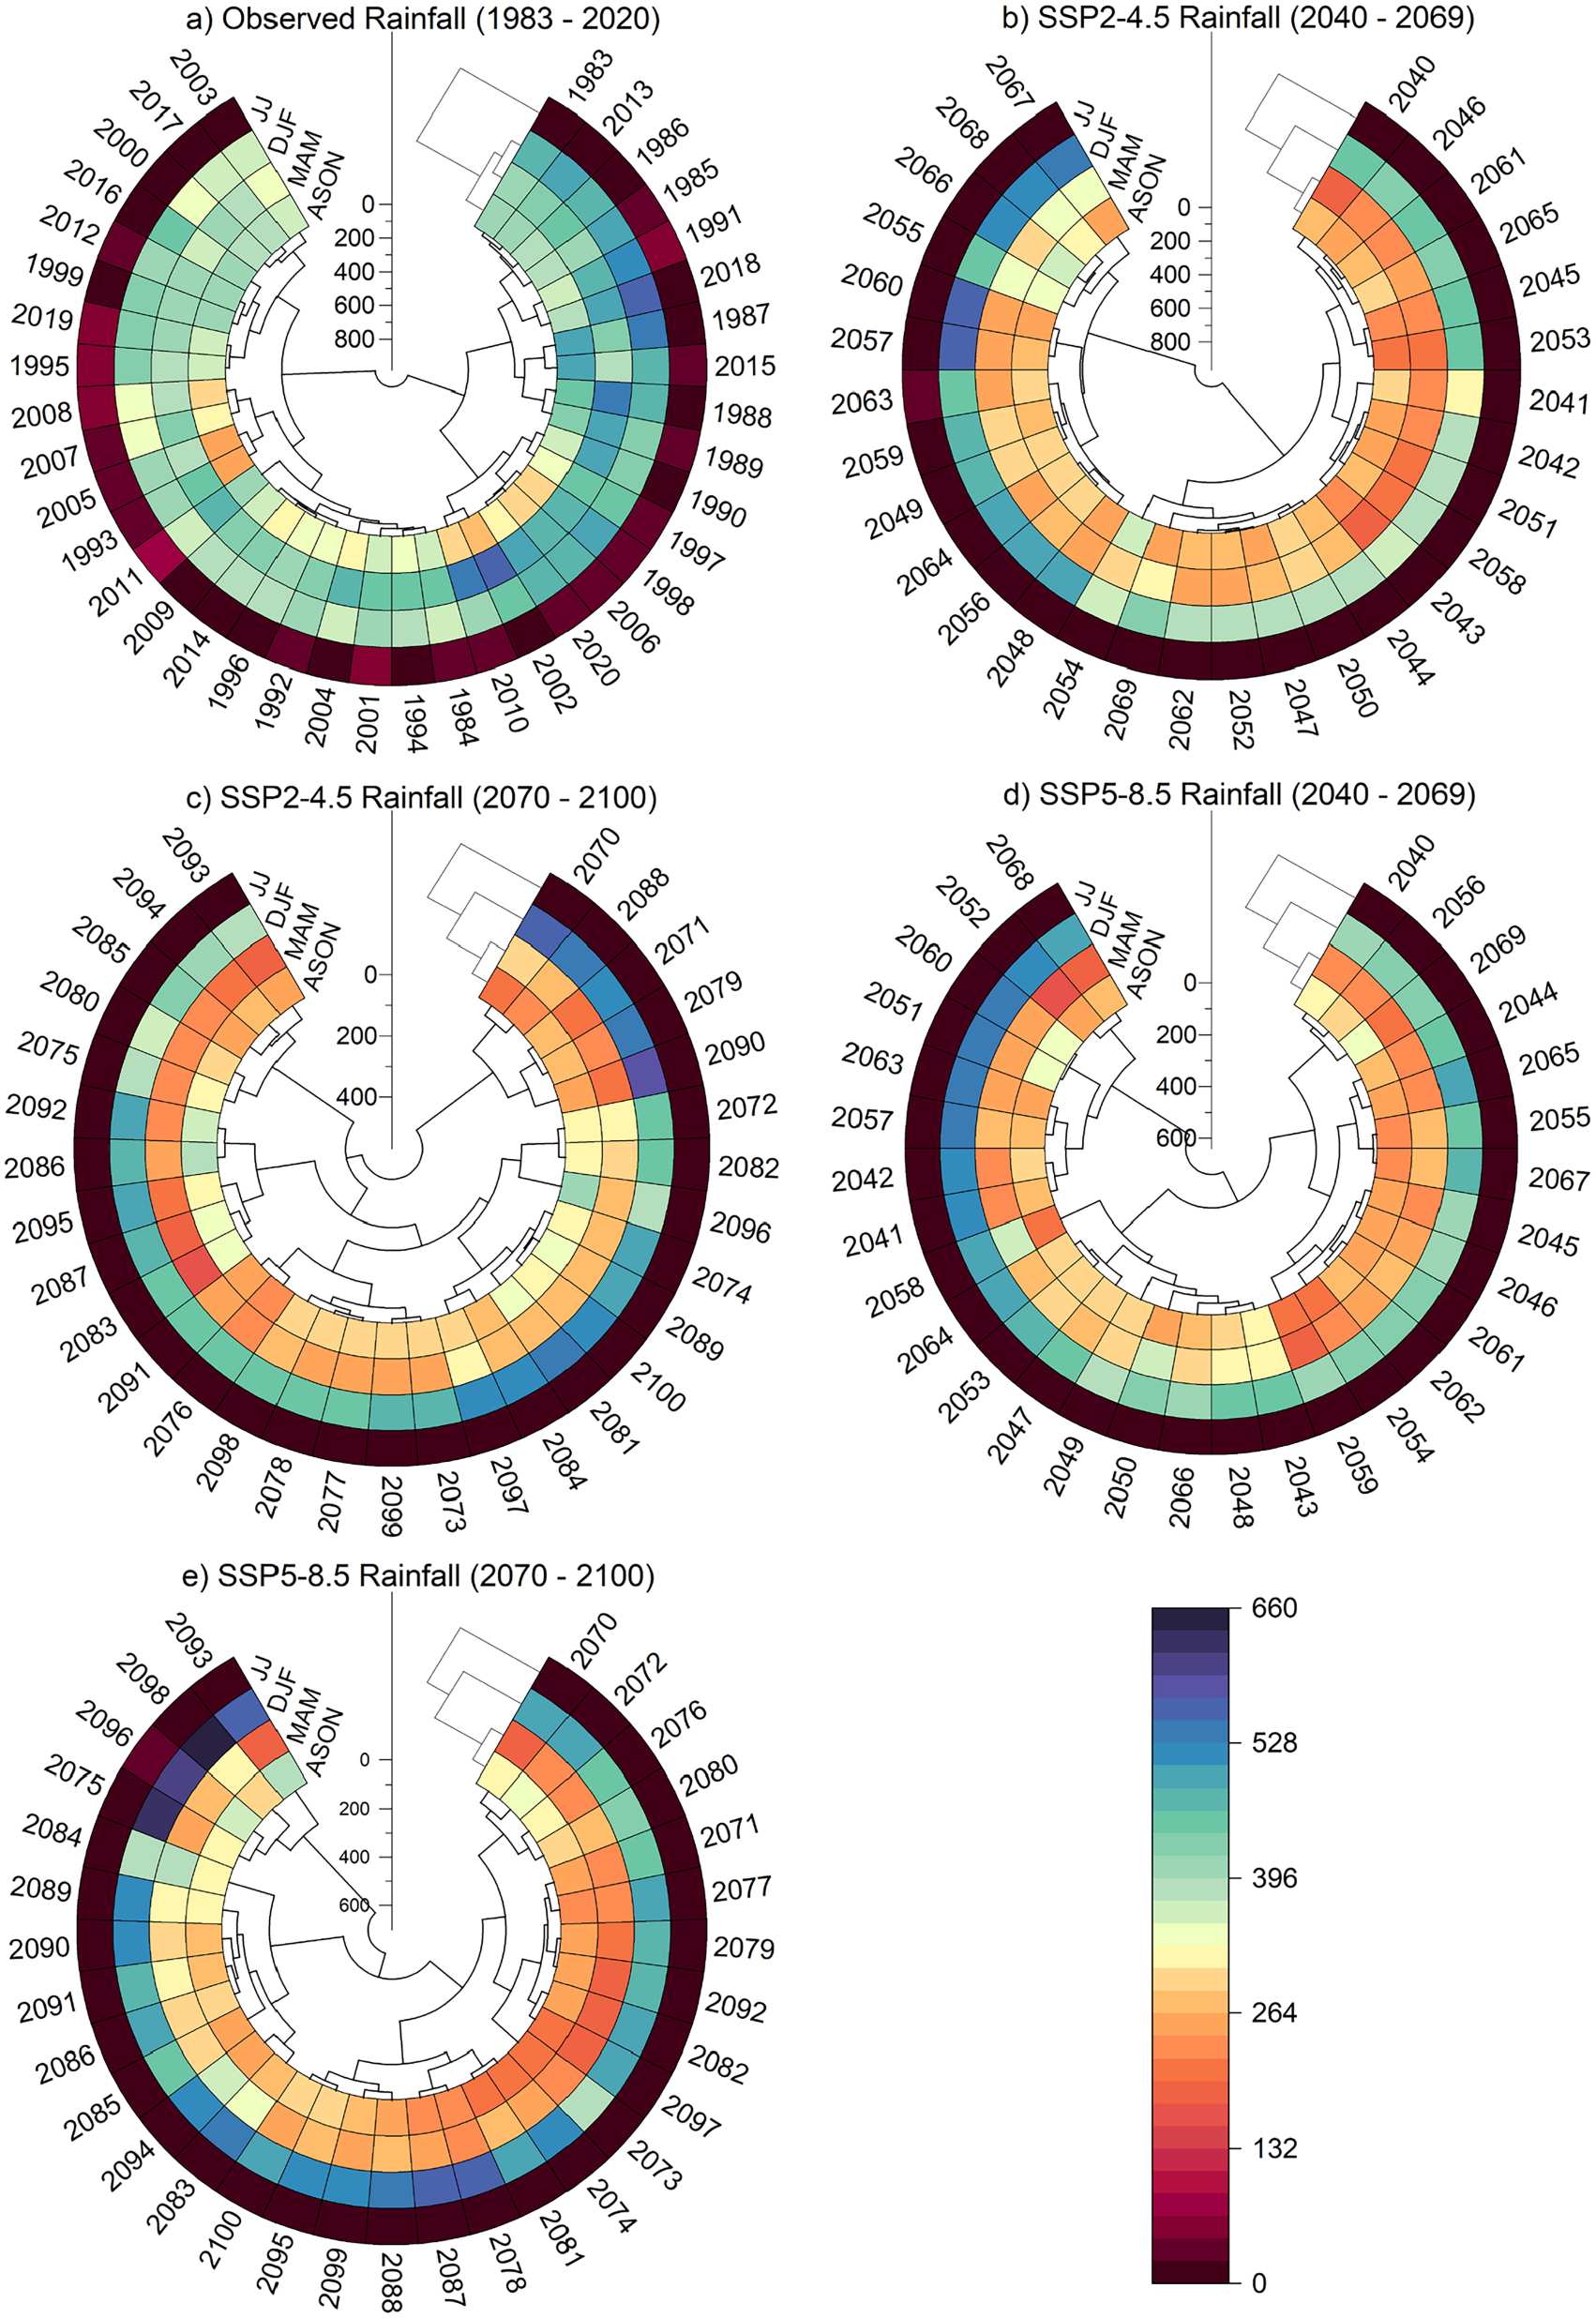
Historical rainfall provides the baseline at upper left. The four future panels show how seasonal totals reorganize under the two emissions pathways and time horizons, with warmer colours marking lower rainfall and blues marking higher rainfall on the shared 0–660 scale.
Figure 11, Ahana et al. (2025). Reproduced from the author-provided article; display size adjusted. Source paper
Figure 12 · Temperature
Maximum temperatures shift decisively upward
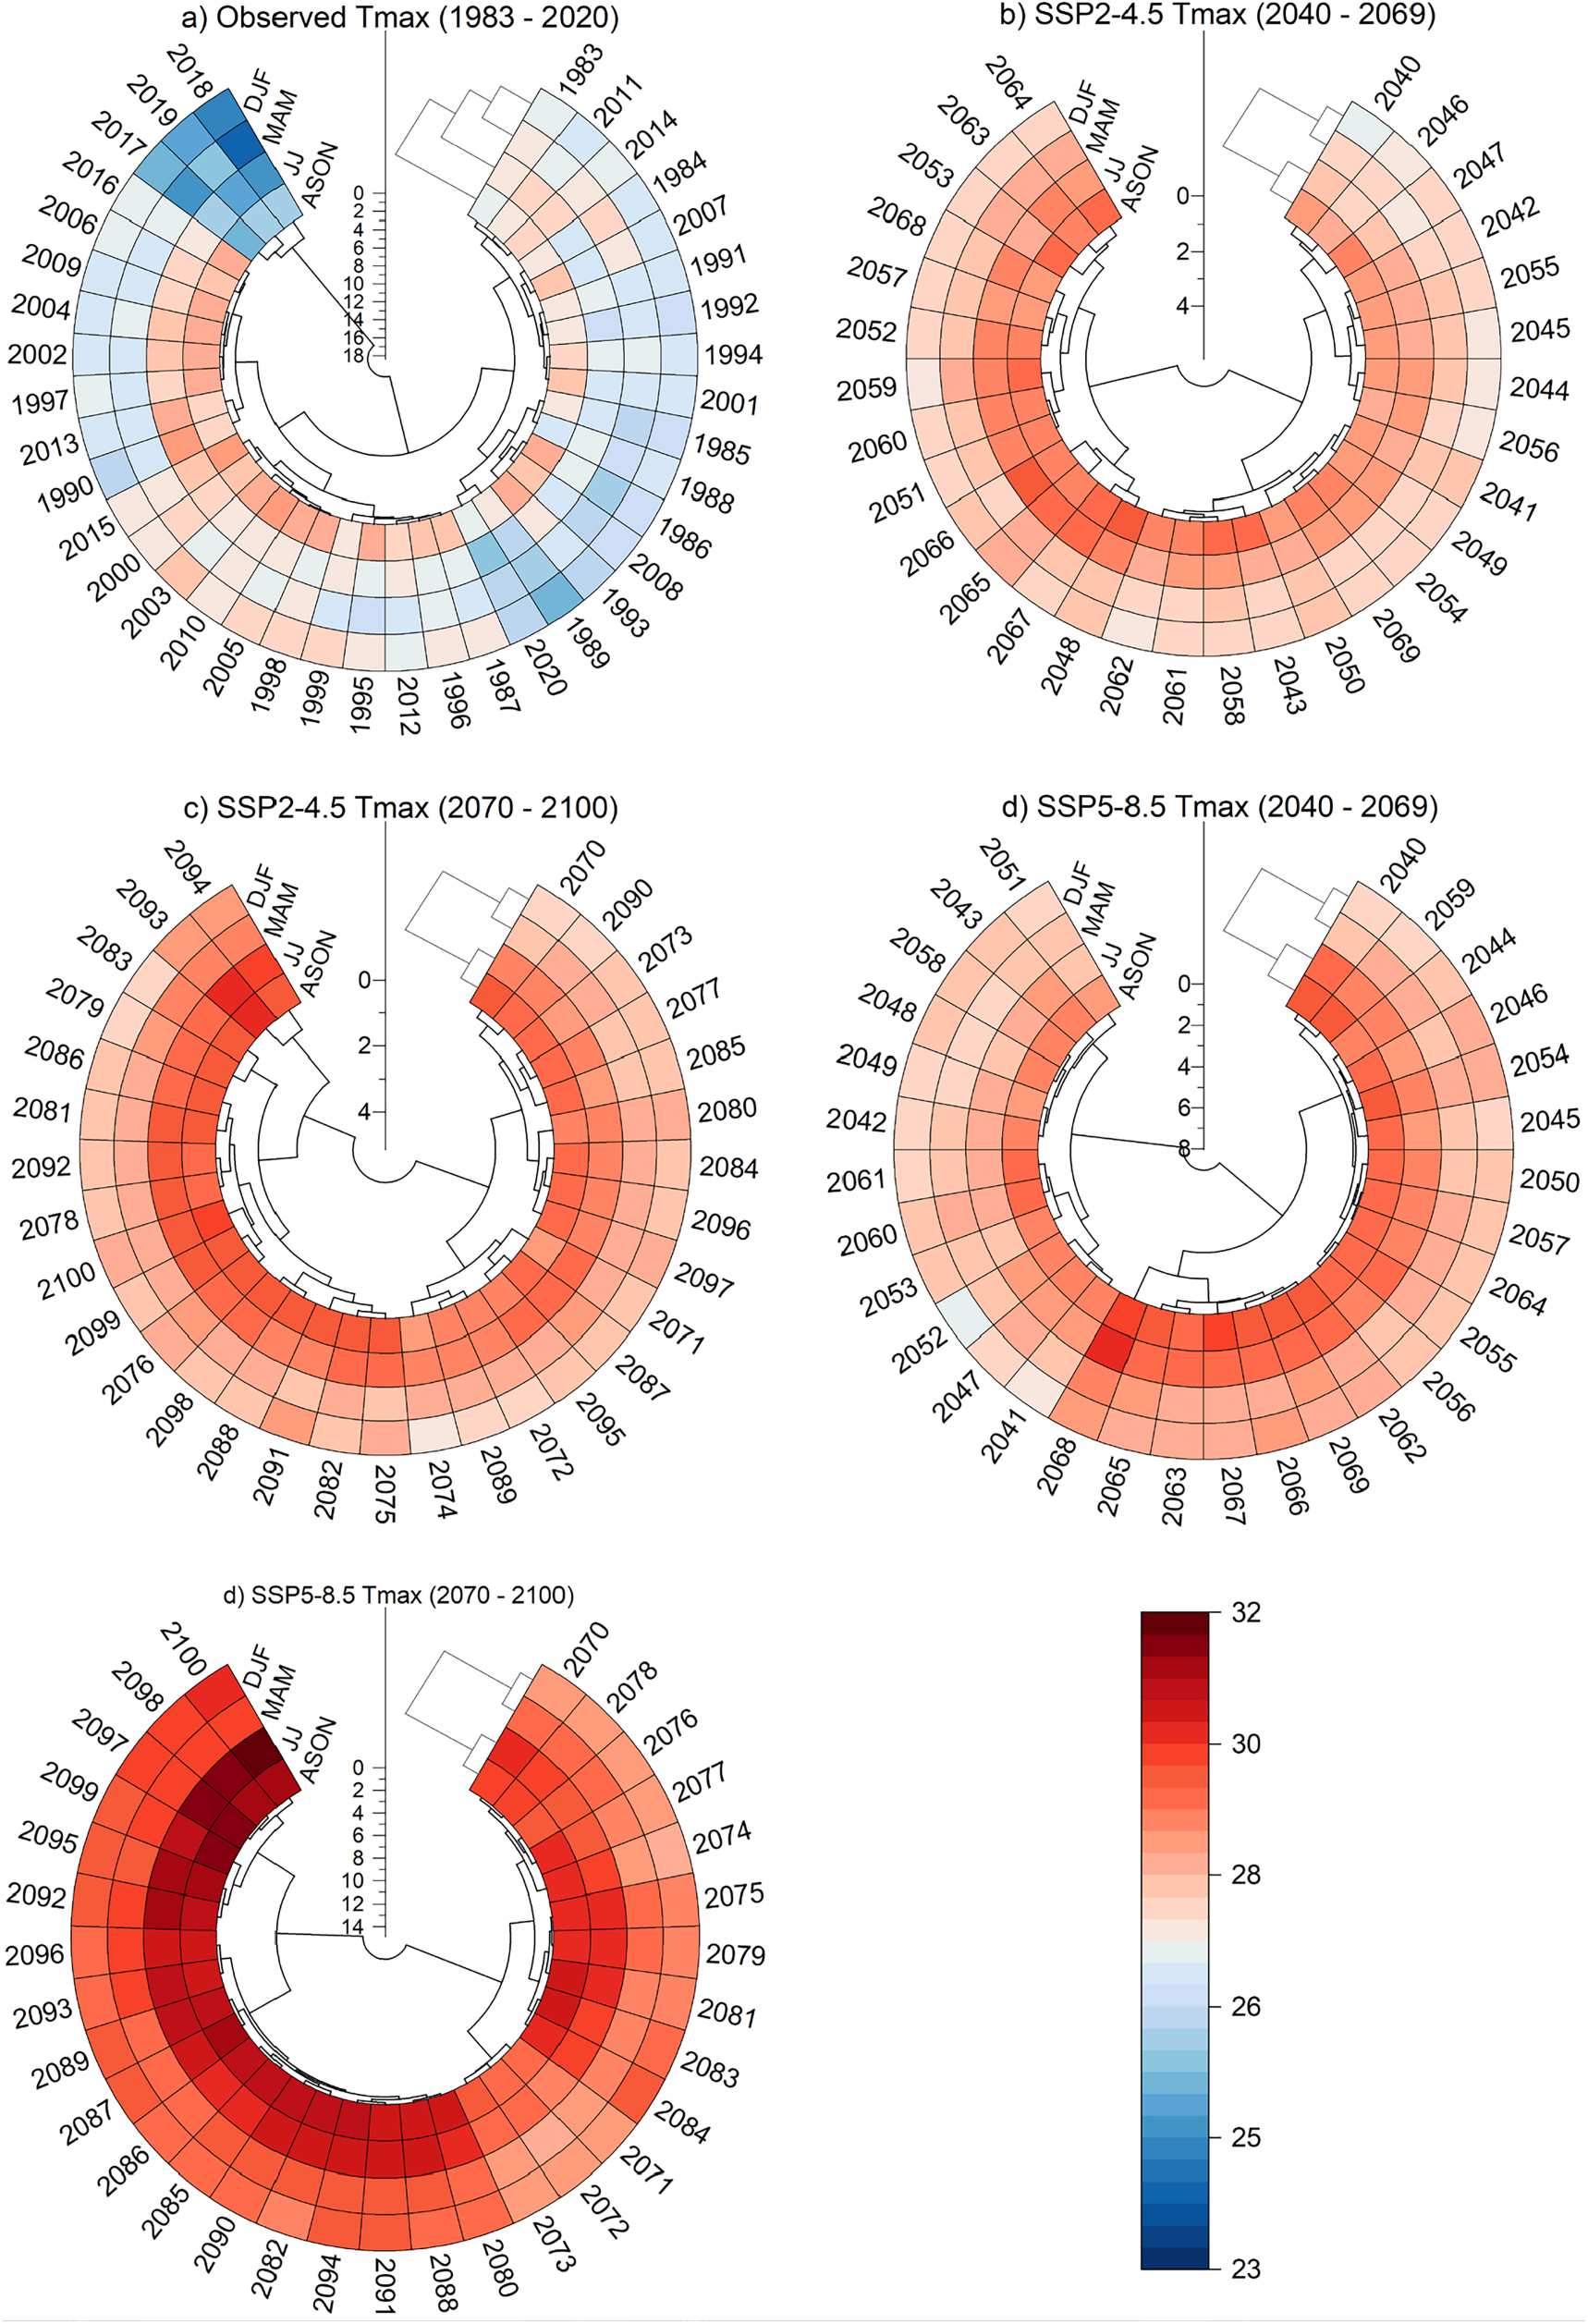
The historical panel includes cooler blue seasons, while the future panels become increasingly orange and red. The strongest and most uniform warming appears late in the century under SSP5-8.5, where much of the seasonal record approaches the upper end of the 23–32 °C scale.
Figure 12, Ahana et al. (2025). Reproduced from the author-provided article; display size adjusted. Source paper
04 / Contribution
My role as first author
As first author, I contributed to the study’s conception and design and, with co-authors, to data curation, investigation, formal analysis, methodology, software, preparation of materials, and the original manuscript draft, as recorded in the published contribution statement.
05 / Interpretation
What the lag can and cannot represent
SPI and SSI reduce complex climate and river behaviour to standardized indices. The estimated lag depends on index time scales, model structure, climate inputs, and the way reservoir operations are represented. A shorter modelled lag signals a planning risk; it is not a precise countdown for every future drought or flood event. Operational records and coordinated reservoir data would strengthen future assessments.
Publication
International Journal of River Basin Management · 2025
Ahana, B. S., Nguyen, B. Q., Kantoush, S. A., Posite, V. R. & Abdelbaki, C. (2025). Influence of existing reservoirs on the propagation from meteorological to hydrological extremes under climate change in the Ruzizi river basin: historical assessment and future projection. International Journal of River Basin Management.